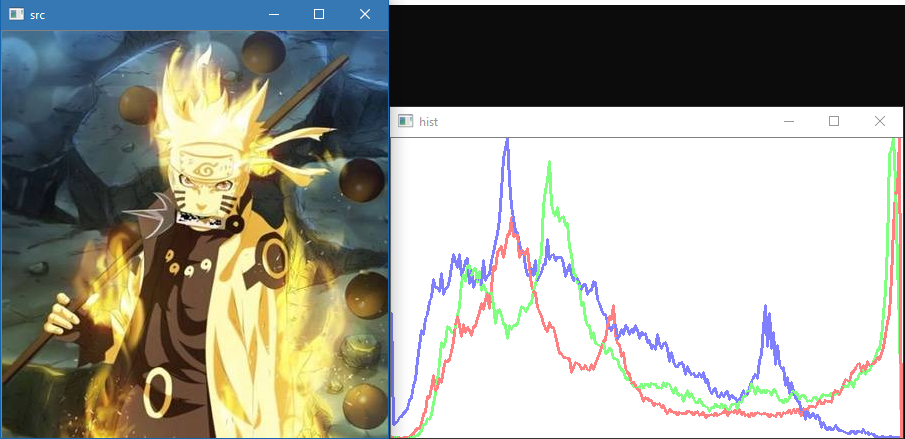
什么是直方图
统计学是指对整个图像在一定范围内的像素值统计出现频率, 而绘制出的直方图, 称之为图像直方图
- 反映的是数据的分布情况
直方图的作用
通过统计学获取到的直方图, 它反映像素出现的概率, 通过非线性拉伸的方式处理图像可以获取更好的动态效果
绘制流程
- 分离像素通道数据
- 统计每个通道表示颜色分量 数值出现的次数
- 将值归一化到我们想要的范围
- 绘制图表
绘制代码
#include<opencv2/opencv.hpp>
#include<vector>

using namespace cv;
using namespace std;

void main() {
	Mat src = imread("F:/VisualStudioSpace/OpenCV/Resource/Naruto.jpg");
	if (!src.data) {
		printf("Read data failed");
		return;
	}
	imshow("src", src);
	// 1. 分离颜色 B, G, R 通道的数据
	vector<Mat> bgrs;
	split(
		src,   // 要分离图像
		bgrs   // 将原图的数据分离到 BGR 的集合中
	);
	// 2. 计算直方图的数据
	Mat hist_b, hist_g, hist_r;
	const int hist_size = 256;
	const float *ranges = new float[2]{ 0, 255 };
	calcHist(
		&bgrs[0],   // images:     输入的图像
		1,          // nimages:    输入图像的个数
		0,          // channels:   第几通道
		Mat(),      // mask:       掩模
		hist_b,     // hist:       计算后的输出矩阵, 存储每个等级出现的次数
		1,          // dims:       需要统计的通道数
		&hist_size, // histSize:   直方图等级的个数
		&ranges,    // ranges:     直方图数据的范围
		true,       // uniform:    true 表示对得到的图片进行归一化处理
		false       // accumulate: 在多个图像时, 是否累计计算像素值的个数
	);
	calcHist(&bgrs[1], 1, 0, Mat(), hist_g, 1, &hist_size, &ranges);
	calcHist(&bgrs[2], 1, 0, Mat(), hist_r, 1, &hist_size, &ranges);

	// 3. 数据归一化处理
	int hist_y = 300;             // 坐标系 Y 轴大小
	int hist_x = 512;             // 坐标系 X 轴大小
	normalize(
		hist_b,       // src:       需要归一化的数据
		hist_b,       // dst:       归一操作后输出
		0,            // alpha:     低区间
		hist_y,       // beta:      高区间, 即将 hist_b 中的每个数据归一化到 [alpha, beta] 中
		NORM_MINMAX   // norm_type: 归一的类型(NORM_MINMAX 缩放到指定区域)
	);
	normalize(hist_g, hist_g, 0, hist_y, NORM_MINMAX);
	normalize(hist_r, hist_r, 0, hist_y, NORM_MINMAX);

	// 4. 绘制图形
	Mat hist_image(hist_y, hist_x, CV_8SC4, Scalar(255, 255, 255));
	int paintWidth = hist_x / hist_size;
	for (int i = 1; i < hist_size; i++) {
		line(
			hist_image,
			Point((i - 1) * paintWidth, hist_y - hist_b.at<float>(i - 1)),
			Point(i * paintWidth, hist_y - hist_b.at<float>(i)),
			Scalar(255, 0, 0),
			paintWidth,
			LINE_AA
		);
		line(
			hist_image,
			Point((i - 1) * paintWidth, hist_y - hist_g.at<float>(i - 1)),
			Point(i * paintWidth, hist_y - hist_g.at<float>(i)),
			Scalar(0, 255, 0),
			paintWidth,
			LINE_AA
		);
		line(
			hist_image,
			Point((i - 1) * paintWidth, hist_y - hist_r.at<float>(i - 1)),
			Point(i * paintWidth, hist_y - hist_r.at<float>(i)),
			Scalar(0, 0, 255),
			paintWidth,
			LINE_AA
		);
	}
	imshow("hist", hist_image);

	delete[]ranges;
	cvWaitKey(0);
}